by Kincaid Gould | May 23, 2022 | General
In early December 2021, I submitted a Public Records Request to Jefferson County seeking concrete data on how many COVID-19 cases were in the fully vaccinated, partially vaccinated and unvaccinated categories. In April, I received a redacted spreadsheet containing data from the very first case in March 2020 up until February 24 of this year. The data do not support the claim that the vaccines have had any significant effect on reducing transmission of the Omicron variant locally.
[Note: The spreadsheet that I received was released as a series of images, not a sortable spreadsheet. I have therefore had to count the occurrences of each event by hand. I have made my best effort to get the correct numbers for this article, though it is possible that there was an extra case here or there. If the numbers are not exactly correct, they should be close.]
The most striking feature of this spreadsheet is the column that indicates a person’s vaccination status. The column is filled with a variety of markings indicating how many doses a person had at the time of their symptom onset or their test date.
This specific data was, of course, the most relevant to my question. It is also undoubtedly the data which Public Health Officer Dr. Allison Berry and Jefferson County Public Heath utilize the most frequently to encourage getting vaccinated, saying that the data clearly show that you are more likely to get COVID if you’re unvaccinated.
It was therefore surprising to find that, starting in January (during the relative flood of positive tests reported during the Omicron surge), the vaccination status column becomes only fleetingly filled in. Whereas every cell had something written in it in prior months, there are 498 cases in January 2022 where the vaccination status is simply not listed. That’s a weighty fraction of the 1104 total cases reported that month. It gets even worse in February, with only 104 of the 403 cases having any vaccination information supplied; 299 of the reported cases offer no indication whatsoever.
Note that 797 cases, more than half of the 1507 total cases added to JCPH’s COVID count in January and February, lacked any vaccination status information whatsoever. And yet, to the extent of my knowledge, there has been no mention of this lack of data by Health Officer Berry in the recent months. Not a peep.
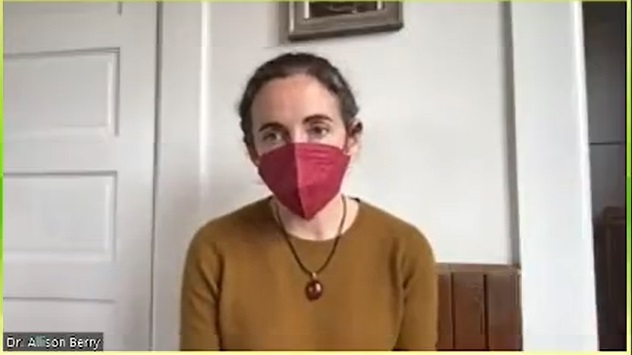
Health Officer Berry Zooming into the May 9 BoCC Meeting after learning her daughter tested positive for COVID-19
Public Health appears to be quite comfortable drawing conclusions from a data set missing half of its data. In fact, on January 28, 2022, JCPH stopped reporting the local case rates among the two groups altogether:
“[T]o clarify the impact vaccination status has on COVID-19 case rates… [p]ercentages of cases among the fully and not fully vaccinated in Jefferson County are no longer included on our table.”
Subsequently, the agency started linking to the Washington State Department of Health’s website, which sporadically releases a report on the breakdown of cases in the fully and not fully vaccinated in each county.
At the March 7 Board of County Commissioners meeting, Dr. Berry noted that “state and national numbers do not include antigen tests… all of those case rates at the… state level are only PCRs. That didn’t used to make as big of a difference when very few people were using antigen tests, but in the last month or so, hundreds of millions of antigen tests were pushed out to the public.” She went on to note that antigen tests are counted in Jefferson County, and this is shown in the spreadsheet.
At the April 18 BoCC meeting, the Health Officer said that between 70 and 90 percent of tests reported to JCPH are home antigen tests. During the months of January and February, this rate considerably lower, hanging around 30-40%. At any rate, it’s still a large percentage of the cases. In stopping access to local case rates among the vaccinated and unvaccinated, JCPH has forced us to rely on the state DoH data, which the Health Officer’s assertions suggest may be missing a significant portion of positive antigen tests. How can this be in the public interest or beneficial from a public health standpoint?
But let’s step away from the missing antigen data from the state and refocus on the missing vaccination status data from the county. Despite this gaping hole in the data set, neither Dr. Berry nor JCPH made any comments about a lack in data when positing that Jefferson County was doing “better” than other parts of the state and the country at large because of its high vaccination rate, or that getting vaccinated will lower one’s likelihood of getting COVID. But not only do our local data from that time not support this latter hypothesis; the (known) data actively refute it.
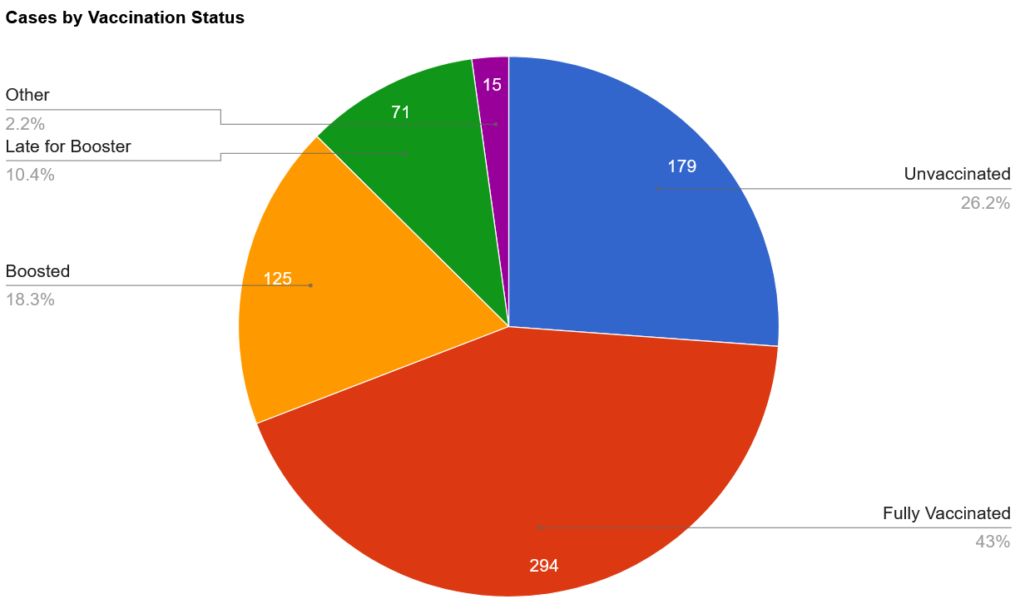
Let’s consider the data from 2022 more closely. If we remove the 797 cases where vaccination status is not listed, we’re left with 710 cases. For purposes of calculating vaccine efficacy, it doesn’t make sense to count cases in children who couldn’t be vaccinated—that would include children 0-4 years old, for whom the vaccine is still not available. There were 26 cases within the time range that had a listed vaccine status—25 unvaccinated, and 1 triple vaccinated, the latter almost certainly a severely immunocompromised child. Removing these 26 children gives a total of 684 cases to work with.
Out of those 684, there were 179 who were clearly labeled as being unvaccinated. 294 were fully vaccinated and were either not due for their booster dose or had no indication that they were late for their booster dose. 125 were boosted. 71 were late for their booster dose or had had their booster dose within 2 weeks prior to their symptom onset. 3 cases in partially vaccinated people (e.g., “1 shot only”) and a smattering of unclear or miscellaneous markings make up the remaining 15 cases, which I’ve placed in the “Other” group in the chart below.
If we translate this into percentages, we have roughly 26.2% of cases in unvaccinated people, 71.6% in those who have received at least two doses of the vaccine, and the remaining 2.2% in people with various miscellaneous statuses.
To determine vaccine efficacy data from this data set alone, the only remaining step is to correct for the relative sizes of the two groups. According to JCPH’s website, 75.8% of the Jefferson County population was fully vaccinated as of February 25, 2022. That means that we would expect 75.8% of the cases to be in the fully vaccinated if the vaccine didn’t reduce one’s chance of catching the virus.
As we can see, the number we’ve come up with (at least 71.6%) is very close to that number, though slightly lower. This suggests that being vaccinated may reduce one’s chance of being infected with Omicron—but if it does, that protection doesn’t seem to be very substantial, as the group accounted for only about 4% fewer cases than would be expected if the vaccine didn’t prevent infection.
Of course, an analysis of this type of data must be taken with a large grain of salt, as there are many confounding factors at play. For one, we know that this data represents fewer than 50% of the total positive tests from January and February. While the scenario is unlikely, if it turned out that all 797 unknown cases occurred in the same group of people, the percentages would significantly shift.
On the other hand, it is feasible (and perhaps even likely) that the distribution of cases in the vaccinated and unvaccinated among the unknown status group would be similar to the distribution among the known status group, so the pie chart above may well be a good indicator of the distribution of cases in Jefferson County. Whatever that distribution is, however, it’s likely to remain unknown. In response to a follow-up email I sent to Public Health asking whether the missing data from the empty cells would be added at a later date, I received a response saying that “No, we have not been able to research vaccination status for past cases.”
We must simultaneously grapple with the fact that the size of each group (vaccinated and unvaccinated) may not be proportional to the size of each group being tested—in other words, it is possible that fewer than 75.8% of the COVID-19 tests are being taken by fully vaccinated people.
For example, if a company requires unvaccinated employees to test weekly for the virus, but has no such requirement for vaccinated workers, this could contribute to an artificial manifestation of a greater case rate in the unvaccinated population simply because they are being tested more often.
The extent to which such procedures are carried out in Jefferson County is not clear, but it is certainly the case in the schools. According to Jefferson County’s “Return to School Flow Chart,” non-fully vaccinated students and staff who have been exposed to COVID-19 must test more frequently than those who have been fully vaccinated. (Note that Port Townsend School District, according to another public records request, was churning out upward of 1000 tests per week in January, and that the other school districts likely had high totals as well.)
The problem of false positives (and negatives) should also be considered. Because a diagnosis by a physician or other medical professional is not necessary to add to the COVID-19 case count in Jefferson County, faulty tests could easily add to the number of cases. If a completely healthy employee is forced to take a test with a 95% accuracy every day, they are expected to churn out a false positive once every 20 days. COVID tests have a variety of accuracy ranges. The possibility of someone having COVID but getting a false negative is also possible.
We also must deal with the nature of the data that’s been collected. Several different people have added information to the spreadsheet, and while there do seem to be some conventions adhered to by most, different people could easily have different tendencies when filling in data. Some entries are much more specific than others, sometimes specifying, for example, the type of vaccine given and its date of administration, while others give only the bare minimum.
Is it possible that somebody, in haste, inputted an entry of “no” in the vaccination status column when the individual was “partially vaccinated”? (When JCPH was still publishing its case rates in the fully vaccinated and not fully vaccinated, partially vaccinated cases were lumped into the latter column together with those who had not received even a single dose of the vaccine.)
Is it possible that someone who was late for the booster did not have that marked down in their cell? There are many different possibilities, and consequently the extent to which these personal choices were applied cannot be puzzled out by simply looking at the table, making it even more difficult to draw solid conclusions.
What about hospitalizations and deaths?
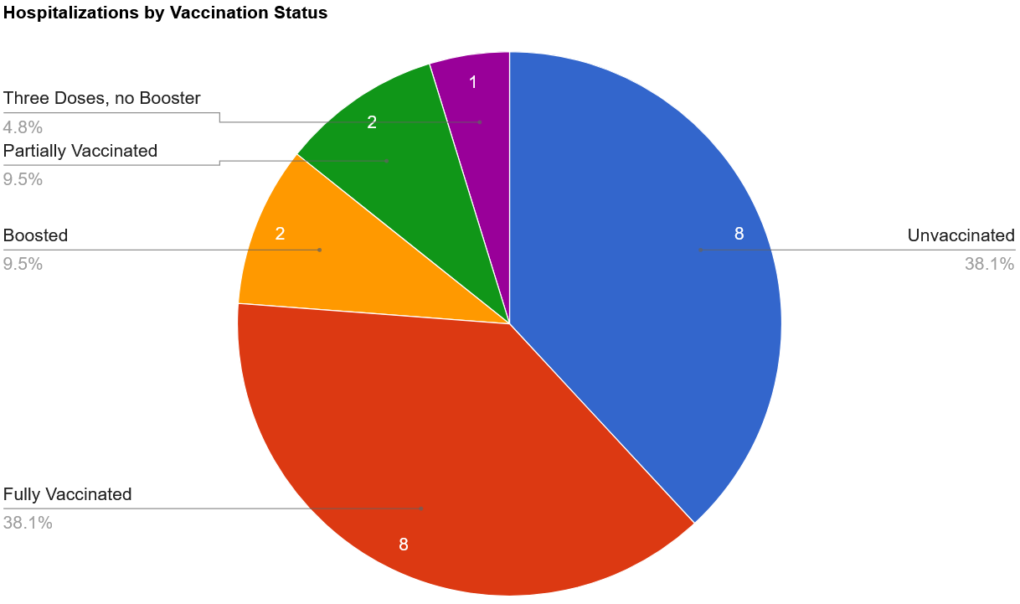
There were 27 total hospitalizations in the first two months of the year, with the majority of them (21) occurring in January. In order to hypothesize vaccine efficacy against hospitalization, we are forced to remove 5 of these cases where the vaccine status was left blank. We also should remove the 1 case where the vaccination status was listed as “Not in WAISS,” bringing us down to 21. (WAISS stands for Washington State Immunization Information System, and, according to Public Health, has only been consulted for a small number of cases. Vaccinations that were administered outside of the state or by the military are not recorded in WAISS.)
There were 8 cases in those listed as unvaccinated; 8 in those who were fully vaccinated; 2 in boosted individuals; 2 partially vaccinated, and 1 who had received three doses but was not boosted (likely immunocompromised). Totaling these up, we have 8 cases in the unvaccinated, 2 in the partially vaccinated, and 11 in those who had “completed their primary series.”
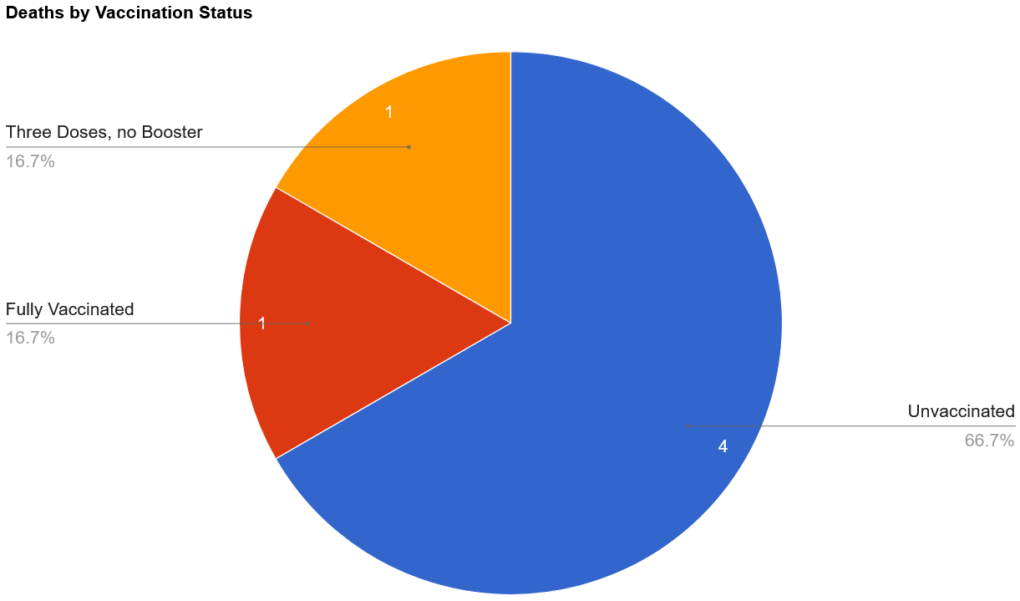
There were only 6 deaths, all of them the result of cases that were added to the official count in January. Of those, 2 of them lacked data on vaccination status, 2 were listed as unvaccinated, 1 of them had 3 doses but was not boosted, and 1 was fully vaccinated (no info on booster).
I was surprised to find missing data on vaccination status for hospitalizations and deaths. Hospitalizations and deaths are much more severe outcomes than just having a case of COVID. How could such important data be missing? In response to a query about this disparity, I was told that that vaccination status information likely simply “didn’t get updated on the line list when workloads were very high.” (This is also the reason why there are so many blank cells for cases.) However, even though this data is absent from the spreadsheet, it was reported on in The Leader. Parsing the information shared with The Leader by Public Health with the data in the spreadsheet, it becomes evident that the 2 instances where vaccination status was not listed occurred in unvaccinated individuals.
Interestingly (or perhaps as expected), there’s a theme undercutting all of these deaths. According to The Leader, the first death, a man in his 80s, was unvaccinated and had chronic health conditions.The second death, a woman also in her 80s, was unvaccinated and had chronic medical conditions.The man in his 70s (who had received three doses) was said to have active cancer. The remaining three individuals also all had “chronic medical conditions.” In other words, 100% of the people who died during the Omicron surge (January-February) had chronic medical conditions.
Nevertheless, the percentage of deaths in the unvaccinated (66.7%) is much greater than expected; the percentage of unvaccinated hospitalizations (38.1%) is also quite a bit higher than anticipated. This suggests that the vaccine may have an effect at preventing Omicron-related hospitalizations and deaths.
However, there are confounding factors at play here, as well. One of the most important problems to consider is that we don’t know that any of these individuals actually had the Omicron variant. It’s quite possible that some, or perhaps even all, of them were hospitalized or died with the Delta variant. Recall that all of the deaths occurred in January, closer to when the Delta variant was still the main variant in the community. This is important because the two variants are different in terms of mortality, and a vaccine that protects against one variant isn’t necessarily effective in warding off another.
Regardless of how effective the vaccines were against the Delta variant, there is a general consensus that they are very much less effective against Omicron; in fact, Albert Bourla, CEO of Pfizer, noted in an interview on January 10 that “two doses of a vaccine offer very limited protection, if any” against the Omicron variant. The company is also working on the development of a new vaccine, which wouldn’t be necessary if the current ones were effective against the Omicron variant.
We must also consider the small sample size of the groups. With only 20 hospitalizations (with known vaccination status) and 6 deaths, it is difficult to draw meaningful conclusions. One additional or fewer death could shift the percentages by a considerable amount.
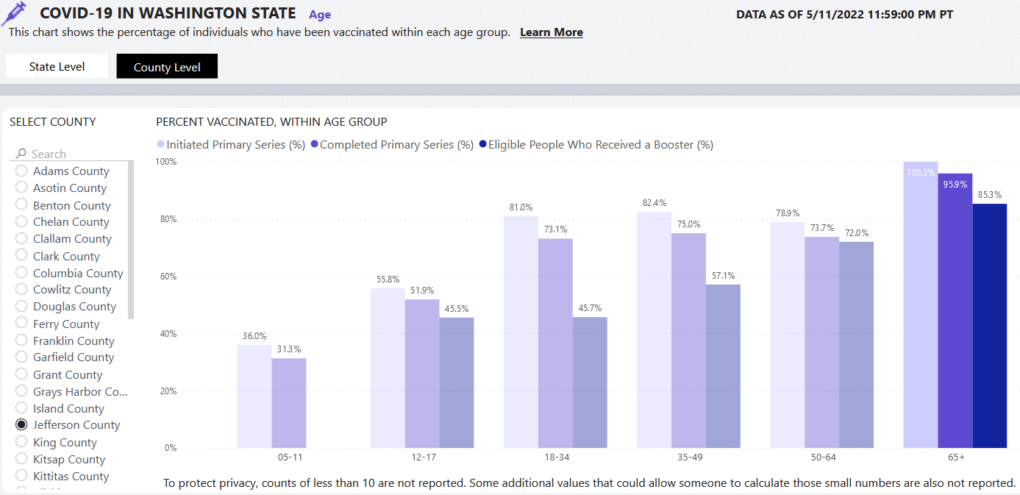
Perhaps even more importantly, we must consider the health of the two groups. Jefferson County is home to a large population of elderly, democratic voters, a group which has shown itself to be very likely to get vaccinated. In fact, if we look at the county-level data on the “Who is getting vaccinated?” tab of the DOH COVID-19 data dashboard, we can see that 100.3% (!) of those over 65 in Jefferson County have at least initiated vaccination. While this is, of course, impossible, and possibly an error resulting from an incorrect population estimate, it does suggest that very few of our county’s seniors are unvaccinated. Indeed, 85.3% of those who were eligible went on to get their booster dose.
Skepticism of the COVID-19 vaccines does not seem to be a thing among the elders of Jefferson County, and so one must ask the question, what might push someone not to get the vaccine? Does the very small number of unvaccinated hospitalization and deaths predominantly include people who had medical contraindications to getting vaccinated? Did a medical professional instruct these people not to get vaccinated because of their condition? When exposed to the virus, would people with chronic medical conditions be more likely to become infected (and thus have to be hospitalized and possibly die) than their healthier counterparts?
Our local Omicron data from January and February point in the direction of a vaccine that is slightly effective at limiting infection, and more effective at preventing hospitalizations and deaths. At the same time, however, there are large holes in the data set that, when filled in, could radically affect how the data could be interpreted. They also present a number of problems intrinsic to the method of data collection and a host of “what if?” questions that seriously hinder drawing any sound conclusions about the efficacy of these injectable products.
While raising more questions than answers, the local data hardly substantiates claims that the vaccines have been effective at preventing infection, hospitalization or death.
by Jim Scarantino | May 19, 2022 | General
Above is a glowing view of San Francisco’s gorgeous Golden Gate Bridge, constructed in under 5 years from 1/5/1933 to 5/28/1937.
What other architectural wonders took less than 5 years to build? A Free Press reader sent us the following list. (Note: The Cherry Street Project is not on this list.)
The Empire State Building, built in 11 months, 3/17/1930-5/1/1931
The Hoover Dam, constructed 4/20/1931-3/1/1936
The Eiffel Tower, constructed 1/1887-3/31/1888
Seattle Space Needle, finished in about 400 days on 4/20/1962
The Pentagon, constructed 9/11/1941-1/14/1943
Disneyland, 1/16/1954-7/17/1955
Transcontinental Canadian Railroad, constructed 1881-1885
The Sears-Willis Tower, built 1970-73
And the tallest building in America since the Sears-Willis Tower was built fast and steadily enough that the Chicago Tribune captured a time-lapse movie of its 2005-2009 construction:
All these marvels got completed in less time than the Cherry Street Project – a rehab of an existing 5,000 sq.ft. building that has been blighting our fair town for 5 years (and counting).
Related: Unhappy Birthday: Cherry Street Project Turns Five Years Old
by Ana Wolpin | May 14, 2022 | General
In a letter to the Port Townsend City Council on May 2, 2022, I wrote:
“There is apparently a vision to eliminate or at least reduce use of the ‘personal automobile’ in our commercial districts… Those of you and others you know who are sold on this vision of a vibrant, car-free shopping/dining/recreating community experience have idealized a concept. You’ve seen it work in Europe or three blocks in Ithaca (where I recently learned a parking garage was built for every block closed to traffic) or during a festival…
A concept is one thing, Port Townsend’s reality quite another.”
My letter was one in a packet of 59 pages of submitted written comments—all negative—about making streateries permanent. At the city council meeting on May 2, following in-person and livestream public comments that with one exception also unanimously opposed the proposal, the notion of codifying streateries long-term was almost tabled. (Thank you, Ben Thomas and other council members who initially supported that motion.)
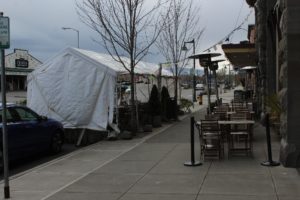
However, as reported in the Free Press on May 5th, the motion to table the initiative was withdrawn. Instead, what some have taken to calling “gutter dining” was extended in the downtown commercial district until December 31st as an ongoing temporary measure. An ordinance to allow permanent streateries uptown and in other business districts was put off for revisiting at the following council meeting on May 16.
So now, despite all the public backlash — talking about how toxic it is to eat in the street amid waves of exhaust fumes, how ugly and unused the tents are, how significant the loss of parking is, and how there is no longer an emergency threatening to put restaurants out of business — these temporary downtown installations are slated to remain for almost eight more months. And an ordinance to permit streateries permanently in other commercial areas is still on the table.
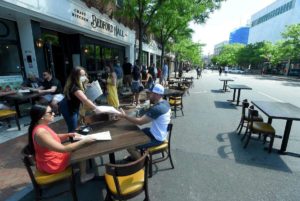
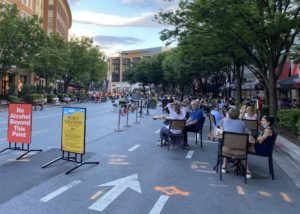
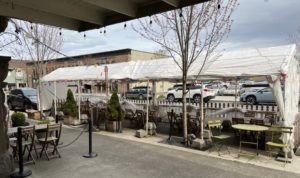
Do a search for streateries online and here are the kinds of images that come up:
These are streateries in Cincinnati, Ohio… Stamford, Connecticut… Bethesda, Maryland… Georgetown, DC. They embody the buzzwords we hear so often about the movement to eliminate personal vehicles in urban areas: friendly, walkable, bikeable, vibrant. What do these welcoming images all have in common? Shirtsleeve weather, roads closed off, no traffic.
What is the reality in Port Townsend? Weather is just one challenge. Safety is another. Not only has the long-lamented parking problem not been addressed for almost two decades, none of the kind of planning needed to reorient traffic patterns to make this kind of streetscape safe is in process. There is a complex set of factors that need to be considered.
But in service to an ideology, in a classic cart-before-the-horse move, the city council still appears intent on creating an ordinance to “just try” some permanent streateries in high-traffic zones. While permission for the downtown streateries is being extended—not eliminated—in temporary status pending the completion of a parking plan, there is a new version of the proposal to create permanent streateries uptown and in other commercial districts coming before council on May 16.
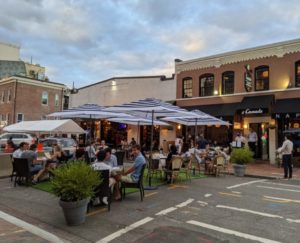
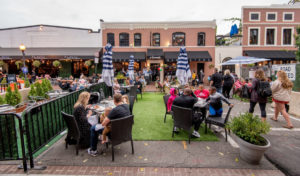
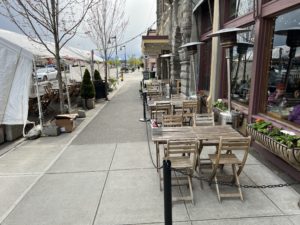
The uptown streatery on Lawrence outside the Seal Dog Coffee Bar appears to be driving this intent. When some of the councilors say “I love streateries,” beyond the ideology they are most often referencing that quaint, funky collection of tables uptown loosely contained by a picket fence where there used to be street parking that is pictured at top. It’s a place where regular patrons like to hang out on nice days, and they enjoy the community it creates.
But tables in the street? Though traffic is slowed coming to and from the corner of Tyler and Lawrence, the set-up along the road is still an accident waiting to happen. The exhaust pouring out of slow-traveling vehicles, often idling just feet away, is noxious. Will a permanent installation fix this?
And what will the visual impact actually be? As I wrote in my May 2nd letter:
“Has anyone actually looked at what a permanent structure would consist of at Seal Dog Coffee Bar uptown? If, as Steve King said, the width of the streatery would be limited to the tiny coffee house’s building frontage, that existing installation would be somewhere between a third and half the size it is now. Two tables if they are sufficiently distanced to pacify those now living in perpetual fear of a virus, three, possibly four small two-tops at a real squeeze. Is that worth a major investment for a small restaurateur?”
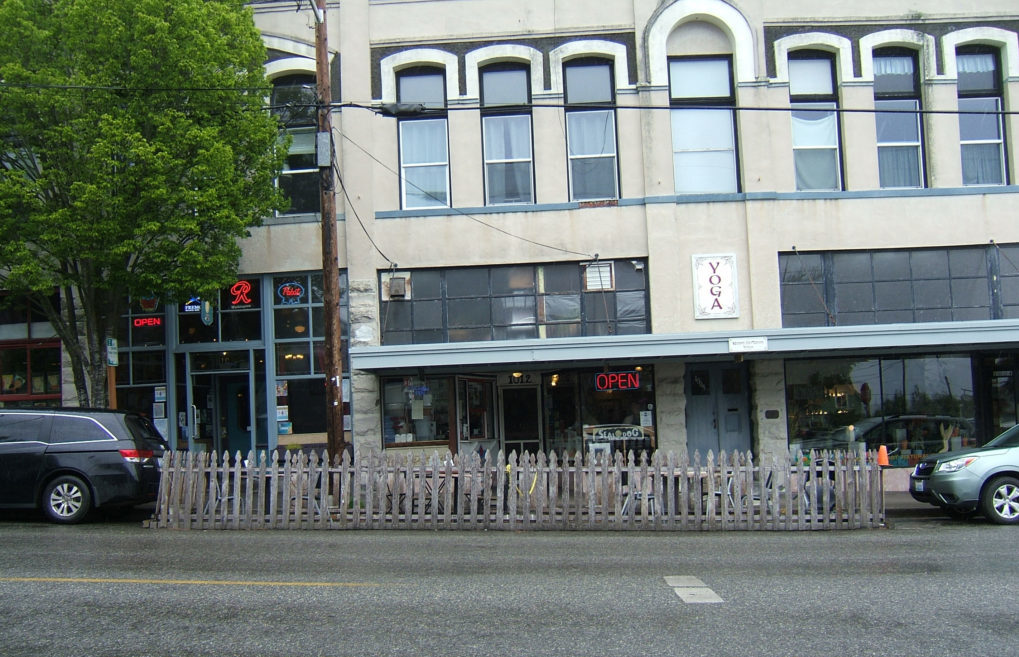
Here is that streatery on Thursday, May 12th, a cool, rainy spring afternoon. Empty. The coffee shop itself occupies the middle storefront with the lower neon OPEN sign. It’s 17 or 18 feet in width. While the 34-foot fenced streatery was vacant at about 12:30 pm, the warm and dry “tiny coffeehouse in uptown Port Townsend” with “welcoming cozy vibes” was hopping inside.
Of course customers will choose a cozy indoor space over sitting outside in the rain. To shelter customers from our weather nine months of the year, a tent or other structure will be necessary. We are told that granting permanent use of parking spots is incentive for the restaurant owner to invest in better structures than the open seating or tents. And we are to trust that because the permanent installations will go through HPC review, they will not detract from one of PT’s biggest draws, our nationally designated historic character.
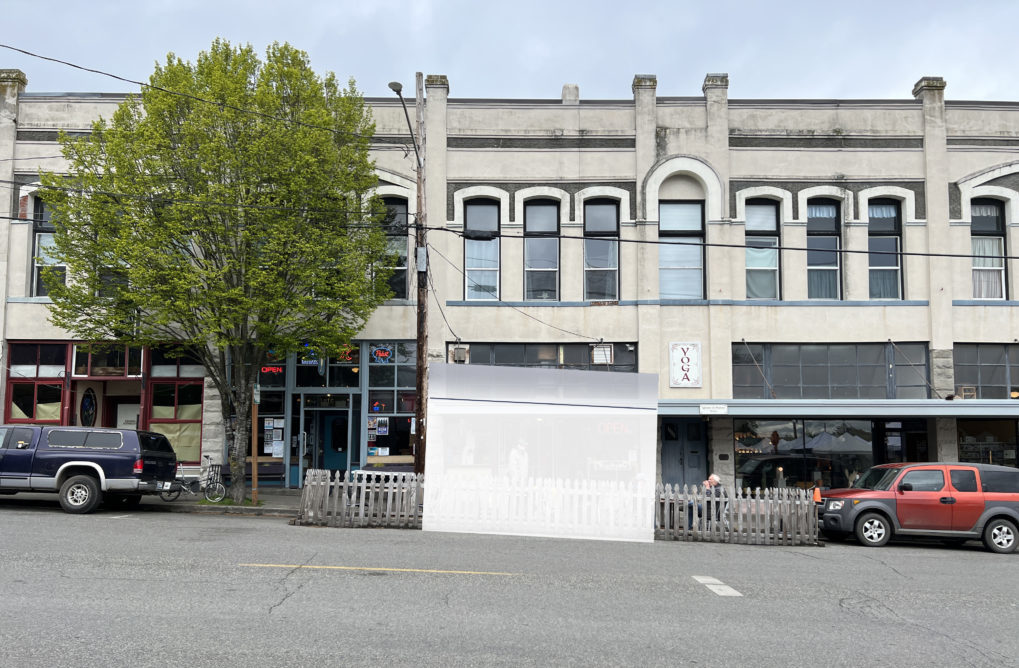
Per the ordinance, a permanent streatery is to be no more than the width of the storefront unless neighboring businesses agree to encroachment. If a permanent streatery outside the Seal Dog consisted of a tent the width of the building frontage, here’s a facsimile of what that would look like (minus the picket fence):
It might have windows. It might not be a tent. But that is more or less the size it would be, intruding on our streetscape. Cars would be able to park on either end where the fence is.
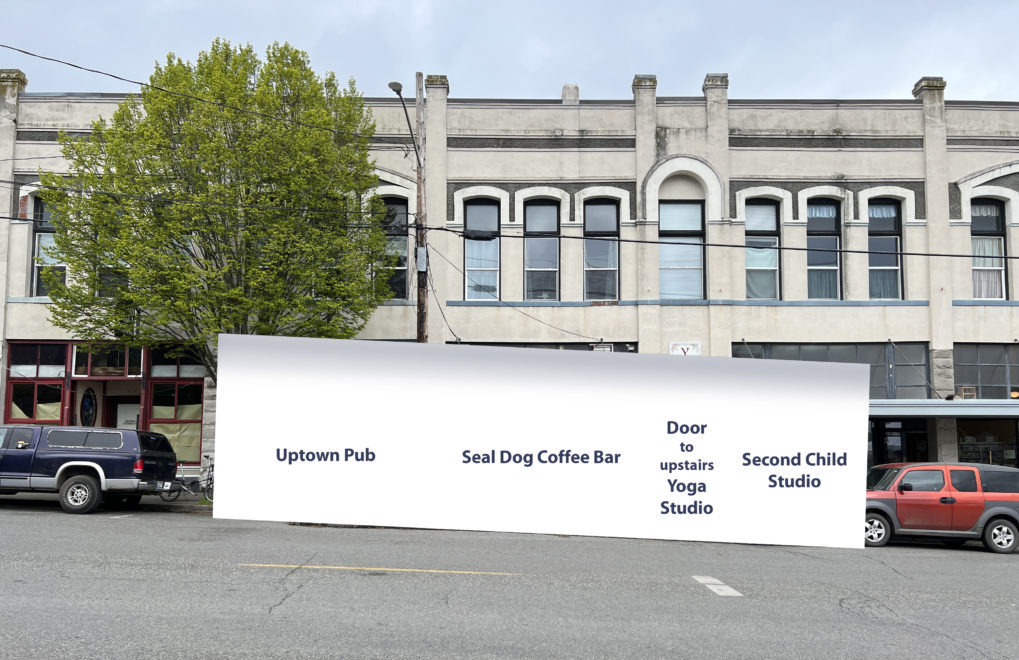
If, as suggested at the meeting by Public Works Director Steve King, permission to encroach on the adjoining businesses was given, the streatery could expand to two allowable parking spaces. Here is what a 40-foot tent or other structure taking the maximum of two spaces might look like:
The window frontage of the Uptown Pub on the left and the Second Child Studio on the right is now obscured. And these sketches don’t depict the concrete barriers, industrial railing or other protective barricades around the tent or solid structure that will be critical to provide even a modicum of safety from vehicular traffic. A quaint picket fence is only a visual deterrent, not a long-term safeguard. The necessary barriers will add to the visual blight.
Are permanent streateries the right solution?
As previously reported, there are already more than forty outdoor dining areas in Port Townsend, nearly all in existence before the pandemic, that are not in the city streets, do not encroach on other businesses, and do not eliminate parking spaces. These include sidewalk cafes like The Old Whiskey Mill’s below, that have tables already allowed by existing city code.
Photo: Stephen Schumacher
At the May 2 council meeting, Ben Thomas pointed to these tables on the sidewalk as an example of other ways to achieve the same goal. Why not make it easier for restaurants to create sidewalk cafes?, he suggested.
But the council instead has an ordinance that was set in motion on March 14 before any public process, which staff and the council have put great time and effort into, offering restaurant owners the permanent use of public parking spaces for street dining installations within busy commercial roadways.
Permanent streateries not only require enclosed structures for all-weather use and high-impact safety barriers because of proximity to traffic, at the May 2 council meeting there was talk of wooden platforms to raise them off the street, and propane heaters to warm them. The whole construct then sits on the street alongside moving and idling traffic spewing toxic fumes. To snap that rainy day photo of the uptown streatery during the lunch hour, I had to wait for a break from a stream of cars and two buses that went by in those few minutes.
Over the course of three city council meetings where permanent streateries have been addressed, only one person has spoken or written in favor of them: restaurant owner Kris Nelson. The proprietor of both Sirens and The Old Whiskey Mill claimed in her public comment on May 2nd that her streatery on Water Street outside the Whiskey Mill had been used all but “approximately 27 days” last year. She acknowledged that the vaxx card requirements, no longer in place, likely accounted for most of that use. Still, we have to wonder what “used” means. Did her wait staff count people at the sidewalk tables which are not in the street and by definition not part of the streatery? Those are already a permitted use in the city code. Since indoor dining restrictions have been lifted, how many meals have been served in the street tent itself?
In the last few months, the tented streatery has been empty in every photo I’ve seen of it, every drive-by, regardless of time of day, level of traffic, rain or shine.
Here is the vacant Old Whiskey Mill streatery on the afternoon of March 30th:
Photo: Harvey WIndle
Again completely empty at 5:00 pm on April 29th:
Photo: Stephen Schumacher
On May 1st at 6:10 pm, the streatery and sidewalk seating looked like this:
That May Day evening, the dinner hour was relatively warm — no wind, no rain, pedestrians strolling the sidewalk. Stephen Schumacher, who sent the above photo to me just after he took it, wrote:
“There were a lot of folks walking around the sidewalk at that time… I had to cool my heels a minute then shoot quickly to avoid getting pedestrian faces in the photo. Strangely there was a guy eating a slice of pizza at the small round green table on the sidewalk NEAR the streatery but not IN the streatery.”
People certainly find al fresco sidewalk dining appealing on a beautiful summer day. They may even try a meal in a tent on the street with cars spewing exhaust just feet away when they have no other choice. But absent the restrictions that ban indoor dining, as I wrote in my letter:
“The streatery was being avoided. This is not a festival with streets blocked off… people do not want to dine in an active city street.”
With so many outdoor dining areas in Port Townsend already available, with sidewalk tables already allowed by existing city code, and with the possibility for our city council to encourage more sidewalk seating through easing of fees and/or regulations, why do we need to put diners in the streets?
At the May 2 meeting, Kris Nelson explained to council:
“My vision of our streatery would be a place… that you can sit outside and eat and drink that feels special and magical and different [her emphasis]… that adds to the fun experience of Port Townsend.”
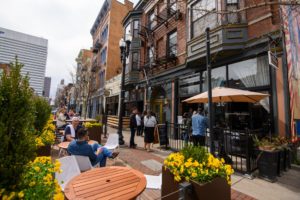
This photo of a Washington, DC streatery during the pandemic is one of the few I could find that didn’t consist of open air tables in fine weather. It has a floor, propane heaters, draped walls and festive lighting… the kinds of amenities we can anticipate if streateries are allowed to be permanent here. And with heat radiating both down and beside the tables, still the diners are eating and drinking bundled up in their winter coats and hats, with cars driving by just beyond the veil. Is this the kind of special, magical, different dining experience we can look forward to?
Would the Seal Dog Coffee Bar want to invest in the kind of permanent structure pictured above? Would its neighbors permit encroachment of their storefronts? The Seal Dog’s existing tables with picket fence eliminate parking, but at least they do not obscure adjacent businesses.
There’s got to be a better solution than a streateries ordinance to allow modest places like the Seal Dog a few tables on the sidewalk where people can enjoy gathering outside in pleasant weather. Do we really need to gift public rights of way in perpetuity to select restaurants in order to achieve a few more outdoor drinking and dining spaces?
On Monday, May 16, the city council will discuss this proposal once again. Public comments can be given at the meeting or written in advance and emailed to publiccomment@cityofpt.us.
—————————————
Additional Streateries Reporting:
Strangulation by Streateries?, March 30, 2022
Public Streets and Public Process Subverted, April 17, 2022
Who is City Council Serving in Their Push for Streateries?, April 30, 2022
Council Backs Off From Downtown Streateries, Contrary to Leader Misreporting, May 5, 2022
by Annette Huenke | May 12, 2022 | General
The following is an update from the Poplars Alliance, sent May 7th to the City’s Engage PT, Port and PUD electeds, The Leader, and the Port Townsend Free Press
——————————————
Dear Engage PT and Elected officials,
Thank you for the opportunity to comment.
It appears that the 9 member Stakeholder Committee that is supposed to have an open mind about our Gateway Poplars already has a predetermined bias against the Poplars. A majority are already on record to cut our community trees down.
The City’s website still says that one of the project goals is to cut the trees down.
• Replacement of Lombardy poplars, an emerging and eventual need for the City
The Port informed us that the selection process for the Stakeholder Committee was an open one, available to the general public. We were also told that all options were on the table. We subsequently requested copies and/or documentation of that notificiation to the general public for this committee formation…and the City was unable to provide us with any announcement for openings that was made available to the general public. The Stakeholder Committee members appear to have been hand-picked and with an existing bias against our poplars.
The Parks Board was able to choose 4 of the 9 members, and the City indicated from the outset that the Admiralty Audubon would be invited. The Port was guaranteed a spot as well. The general public was not allowed to serve on this hand-picked committee, which has been stacked with anti-poplar votes.
We expect our elected officials to engage in truly democratic processes backed by democratic principles. Clearly that is not what has occured.
Below are the slides from the Gateway Poplar Alliance workshop held on April 23, illustrating just this issue, one of many about this ill-conceived project. The entire presentation is available for download here.
By contrast, in a comment submitted ahead of the April 12 Stakeholder Committee meeting, committee member Joni Blanchard pushed back against the narrative that any future PUD trenching would need to kill the poplars. (Consulting arborist Katy Bigelow was contracted by the Port to provide assessment reports in 2013 and again in 2022.)
|
I just read Katy Bigelow’s Poplar tree assessment report.
I needed clarification on her remark in her summary that stated to the effect that ‘no matter where PUD undergrounding occurs, critical root damage would occur and likely cause the trees’ demise’. So, I wrote to her and asked for clarification. Here are my questions and her responses in blue:
If the PUD trenches along the existing Port fenceline (one of their options), which is 25′ away from the Poplars and beyond the 3′ stormwater ditch, that has already been dug between the Poplars and the fenceline, would it still likely kill the Poplars? No.
If the heavy machinery worked from the Port side to dig the trench and stayed off the main roots closer to the tree, wouldn’t that be a safe option for the PUD trenching? Sure.
I just thought that was an important correction that needed to be known as all options are still being considered for this whole project.
It is also good for us all to know that her assessment summary stated that ‘the Poplar trees will likely stand with low but increasing risk‘, and ‘I did not observe any large trunks or bases of trunks with a high potential to fall onto a target‘. (By the ISA hazard rating chart, which she used, low risk means: Insignificant minor issues with no concerns for years to come, and the eventual moderate risk to come would be: no concerns for 10 years or more). That ISA hazard chart was listed at the end of her 2013 Assessment report. Although she suspected basal rot in the 2013 trees, also, they were still classified as ‘low risk‘ of trunk failure.
Her suggestions for maintaining the health of the Poplars and mitigating their offenses (root invasions, sucker sprouts) were also quite helpful. Can be found at the end of her 2012 Assessment report, also. Perhaps if any trees are left standing, these suggestions could be heeded.
I agree with her in that it’s an unlikely location for any kind of a substantial wildlife habitat being a busy work area with lots of noise, along with all the busy traffic.
I also read the Kah Tai ’86 Landscape Plan where it is recommended to selectively thin the Poplars to keep an open view into the Park, and to do pruning and sucker mowing to keep the Poplars healthy and contained. This recommendation is keeping with the following Gateway Plan approved after in 1993 that the Kah Tai group were a part of creating. The Plan that Page 18 of 20 recommended replanting any aging or compromising Poplars with the younger ones that were purposely planted.
Thank you for providing such a comprehensive list of references for everyone’s overall understanding. This information will provide a good basis for working out a compromising plan for the better good of our whole community. |
|
by Jim Scarantino | May 9, 2022 | General
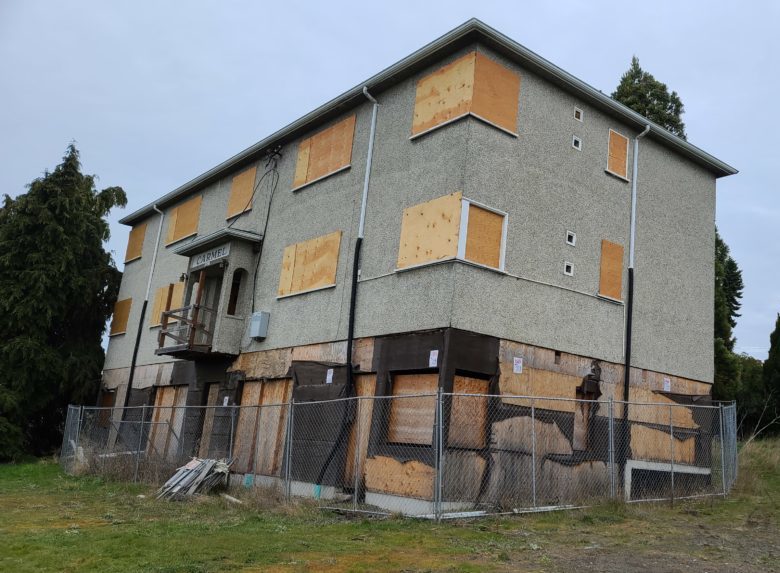
Port Townsend’s most ambitious, costliest “affordable” housing project. Barged from Victoria, B.C. the Carmel House, the building at the center of the Cherry Street Project, sits empty and blighted above PT’s golf course. The 2022 work plan for the City of Port Townsend includes no work on the Cherry Street Project except paying down the $1.4 million indebtedness the city incurred to get the thing rehabilitated. The building has been vandalized and is home to rats and raccoons.
The lessons of this abject failure run throughout our coverage since 2018. The first lesson is, simply, don’t believe what you read in The Leader. From the beginning, the newspaper “of record” has done nothing but act as a stenographer for city leaders and activists. It has been a willing participant in every PR effort to put lipstick on this pig. The Leader has never reported the true cost of this boondoggle, or any of its many failures.
Its most frequent tack was to proclaim “Progress!” even when failure was painfully clear to everyone. The Leader has never asked a hard question of the city or the housing activists — the former Homeward Bound Community Land Trust, recently rebranded as Olympic Housing Trust — who defaulted and wasted millions of dollars in public largesse. The Leader has never looked behind the candied words of the project’s backers, nor dug into public records that show taxpayers have been misled and lied to. Instead, the Free Press has done the work our city’s newspaper should have been doing.
The second lesson is in the dysfunction of an ideologically and politically homogeneous legislative body that operates by peer pressure and virtue signaling. The ultimate failure of this project was evident from the beginning. The city failed to inspect the building before purchasing and floating it across international borders.
Lo and behold, there was a Canadian hazardous materials inspection detailing the presence of asbestos and lead paint the city never saw until a couple years later. The project never could “pencil out” as a viable affordable housing project — not that numbers, which represent taxpayer dollars, seemed to matter to council members. It was more important to make a show of doing something grandiose and kind of artsy about affordable housing than it was to crunch numbers with an eye to reality.
Most shocking of all, the city’s own pro forma for the large loan it extended to the activists showed they would default in a couple years. Council shushed up the lone council member who noticed that and rushed the loan through. By the way, we found and reported that the loan contained a $400,000 hidden interest subsidy that was to be shouldered by taxpayers.
How could an unavoidable, predicted default not matter to City Council? That leads to lesson number three, the antidote to the problem observed as lesson number two.
There must be real diversity in a legislative body to make it work. The City Council that saddled taxpayers with the Cherry Street Project all came from the same political and ideological petri dish. They were a clique of the elite and the woke. It was more important to them to get along, reinforce a narrative, repeat feel-good/look-good buzz words, and nod in agreement than it was to get things right. Someone strong who stood outside the clique and didn’t seek their approval and friendship was needed on council to fight their headlong rush into failure.
The fourth lesson is that Port Townsend Free Press was needed back in April 2017 when council rushed into the Cherry Street Project by buying the Carmel House sight unseen. At least we’ve been hounding this story since we launched in May 2018 with our first article focusing on Cherry Street. Now taxpayers know the ride that has been their misfortune (there’s 17 years left on the bond that funded the defaulted loan, so the ride’s not done).
According to The Leader‘s uncritical reporting, the Cherry Street Project was to have been finished and occupied in the Fall of 2017 with a renovation price tag of only a couple hundred thousand dollars. We did the first of many public records requests and dug into the financial documents to get the real story, published May 28, 2018, just a little after the Cherry Street Project’s first birthday: “Cherry Street “Affordable” Housing to Cost More than $2 Million.” The latest cost estimates put the total cost of the project above $3 million. With the spike in construction costs, count on the price tag being higher today and in the future.
Still a mystery is why the city turned down a $1 million cash offer in September 2020 to bail them out of this mess. Not one city council member ever publicly raised a question about why the city manager gave the back of his hand to Keith and Jean Marzan when they offered to take the mess off the city’s hands and actually build some affordable housing on the site.
The Leader‘s last article on Port Townsend’s hugely disastrous, most expensive, most ambitious affordable housing project was October 1, 2020, when it proclaimed that “Port Townsend will forge ahead with the troubled Cherry Street Project, but with a new nonprofit partner.” The paper accommodated the city’s need for some positive spin on the heels of the activists’ default on their generous loan.
Since that rosy proclamation by The Leader, the only work on the project has been repairing some of the vandalism when teenagers launched a refrigerator through a window and broke out almost all the glass in the blighted 1950s asbestos-and-lead contaminated derelict. Oh, and putting up some fake “this site under video surveillance” signs.
Here is the full list of our reporting on the Cherry Street Project since our first article:
The Tragedy of the Cherry Street Project, 12/12/18
What’s Happening With the Cherry Street Project? 10/29/19
“Completely Bogus” Numbers–More Problems and Delays for Cherry Street Project, 12/2/19
Multi-Million Dollar Fraud on Taxpayers: The Cherry Street Project Unmasked, 6/27/20
Cherry Street Welcomes First Tenants, 2/28/20
Default the Cherry Street Project Now, 4/22/20
Latest Cherry Street Giveaway Hits Taxpayers Harder, 10/2/20
Cherry Street Project Handover “Not a Done Deal,”10/19/20
Accomplished Developer Will Donate Time and Services for Cherry Street Project, 10/20/20
Cherry Street Handover: Red Flags About Bayside Housing, 3/3/21 (and related articles)
Happy Fourth Birthday, Cherry Street Project! 5/10/21
Cherry Street Project Costs Soar in Bayside Housing Proposal, 6/23/21
New Majority on Council Should Kill the Cherry Street Project, 11/27/21
Cherry Street Project Vandalized, 1/4/22
“Incredibly Expensive” Housing Project Follows Cherry Street Debacle, 1/6/22
Mayor Faber (Almost) Opens Up on Cherry Street Project Failure, 4/23/22